

A long term investment strategy

Many investment professionals argue that one key thing you must have in developing an investment plan or strategy is to an estimate of future expected returns. It is said that expected returns will determine your need to take risk. That is, it will inform how high an allocation you need to equities and other risky assets to reach your goal. It is also said that you need estimates of expected returns over the short to medium term in order to adjust your asset allocation as you go along.
Let’s start this discussion by looking at the feasibility of developing numbers for expected returns.
The time frame
Benjamin Graham wrote in 1973: “Today’s investor cannot tell from this record [100 years of data] what percentage gain in earnings, dividends and prices he may expect in the next ten years, but it does supply all the encouragement he needs for a consistent policy on common-stock investment.” (Graham, The Intelligent Investor, 1973) p31.
The critical thing is the time frame. No one can provide a reliable estimate of the return one can expect from equities for a time frame like ten years. The same is almost true for twenty years.
The same is also true for bonds. With bonds one can make a better estimate, but even with bonds one doesn’t know what course inflation will take. Buy ten year government bonds today and you know for sure what your nominal return will be over ten years. What you can’t know is your after inflation return, your real return. Is there a solution?
What can you know?
There is a paradox about the stock market. It is more reliable to forecast long term returns than short term returns. In the short term (from one to ten years and even longer) the stock market is subject to all the vagaries of interest rates, earnings expectations and investor confidence. In the very long term the ups and downs smooth out. In statistical terms it is the law of large numbers asserting itself. Take a look at the following chart of long term returns. The returns are before inflation, i.e. nominal returns. The rate of inflation is also shown so it is easy to subtract inflation to get a real return. The most important numbers are ‘average compound returns’.
US Financial Market Annual Returns and Inflation, 1926–2018

Source: SBBI Yearbook data from Morningstar and Ibbotson Associates
These numbers are consistent with Jeremy Siegel’s book Stocks for the Long Run – The Definitive Guide to Financial Market Returns and Long Term Investment Strategies, in which he wrote: “Despite extraordinary changes in the economic, social, and political environment over the past two centuries, stocks have yielded between 6.6 and 7.2 percent per year after inflation in all major sub periods.” (Siegel, 1998) p.11.
Ok, so if that gives us some reasonable estimates for the long term (and only for the long term), what can we learn about shorter periods?
How CAPE fits with this
In 1988 John Campbell and Robert Shiller published a paper about price/earnings ratios using a ten year average. Today Shiller publishes his CAPE, a cyclically adjusted (for inflation) Price/Earnings ratio—sometimes referred to as the CAPE 10. It averages the most recent 10 years’ earnings and adjusts them for inflation.
Shiller says that: “The relation between price-earnings ratios and subsequent returns appears to be moderately strong…” and that, “We believe, however, the relation should be regarded as statistically significant.” (Shiller, 2005 Second Edition)p.187.
Nowadays CAPE is frequently referred to in analysts’ reports and the financial press in discussions about whether the stock market is expensive and what investors can expect in the years to come. It has a credibility that comes from the fact that its creator Robert Shiller has a high public profile and is a Nobel Prize recipient.
In Irrational Exuberance Shiller wrote, with reference to the stock market’s CAPE ratio: “Long-term investors would be well advised, individually, to lower their exposure to the stock market when it is high, as it has been recently, and get into the market when it is low.” In other words, it is said to be useful as an indicator of relative future returns sufficient to adjust your asset allocation as you go along.
So, CAPE is supposed to be useful as a tool for asset allocation adjustments between stocks and bonds within a short to medium term time frame. That is to say, within Ben Graham’s 10 years. But, as Graham points out you cannot tell what these return expectations will be.
The following chart shows the CAPE 10 going back to the 1880s.
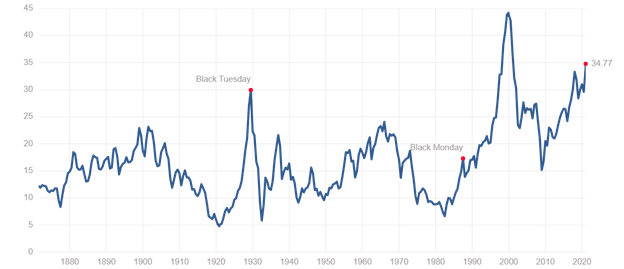
Data courtesy of Robert Shiller
I have several concerns about the use of CAPE to decide whether the stock market is overpriced to the point that one should reduce stock holding. See here, here, here and generally about price/earnings ratios here.
As a result, I don’t make asset allocation adjustments based on my view as to whether the stock market is overpriced or underpriced. I think such activity is market timing. And I don’t think CAPE helps much.
I try to take a long view of the stock market. But, with the long view comes volatility. The best way to understand this is through a visualization.
What the novice investor will have trouble with is Broad Framing a long term investment strategy – that is, they have trouble taking the long view. A novice investor will time frame their investments narrowly. They will look at the performance of their portfolio in the short to medium term, a matter of months or a few years. A Broad Framing investor like Warren Buffett will look at performance over the long haul, many decades.
A graphic representation of the impact of Broad Framing and long term thinking is contained in the following chart. It shows the range of likely returns from a portfolio made up of 95% equities and 5% cash over a thirty year time horizon. The range of outcomes in any one year goes from a plus of over 50% to a negative of over 50%. That is, the one year bar shows the largest growth (i.e. unrealized or paper gain) or largest paper loss in any one year during the time horizon of 30 years. So, the investor is warned that in year 19, for example, whether or not there has been a previous 50% paper loss, there could be one that year. The graphic talks of ‘potential loss’. Of course, a loss would only happen if one sold at the low point. It can be seen that in a 10 year period the likely range of returns is from an unrealized gain of about 25% per annum compounded to an unrealized loss of about 6 or 7% per annum compounded. That is, in any 10 year period that is the likely range of unrealized gains or losses. After 28 years, the range runs from about plus 15 to 17% to essentially no expected loss. The average expected return is about 8% per annum gain. This is consistent with Ibbotson, Morningstar and Siegel.
Range of Expected Returns

Source: Royal Bank of Canada – RBC Direct Investing Inc.
Conclusion
With all this in mind, I have simple asset allocation rule. It is 100% equities for the long haul. There are two qualifications. I always keep an open mind to the possibility of switching to bonds. This applies to a stock market that is not in a bubble. I will only switch to bonds if I decide long term government bonds will produce a better long term return than equities. So far, in many years of investing, I haven’t seen that. The second qualification is how I deal with bubbles. See my post here.
In my own investing I never have any view of, or think about, what our expected returns will be over the next year, five years or ten years. The simple reason is that one really can have no idea and anyway, nothing in my investment process turns on it. I simply try to achieve the maximum real total return over the long haul. I do have a rough idea of real expected returns over the next twenty five years. But again, not much turns on it.
+++++++++++++
To read more deeply on developing a sound investment process check out the Motherlode Chapter 27. Sound Principles of Operation
Want to dig deeper into the principles behind successful investing?
Click here for the Motherlode – introduction.
To access more blog posts check out the scatter index (Tags) on the right side of the Home page that goes from ‘accounting goodwill’ to ‘wisdom of crowds’.
If you like this blog, tell your friends about it
And don’t hesitate to provide comments
4 thoughts on “Expected future returns”