
Capital Structure, Strength and Economic Performance
Earnings can be as pliable as putty

Last week my post was about uncertainty; things that count that can’t be counted. This week we look at the flip side, things that can be counted but may not count. Things that can be counted include numbers, facts, data, models and quantification. That sounds a bit daunting but, bear with me.
In last week’s post I referenced Charlie Munger’s Herb Kay Memorial Lecture at the University of California at Santa Barbara, 2003. He describes a terrible problem in economics, business and just about everywhere else. He says: “Well, practically everybody…overweighs the stuff that can be numbered, because it yields to the statistical techniques they’re taught in academia…” (Emphasis added)
Munger says it’s a special version of this “man with a hammer syndrome”. It’s known as Maslow’s hammer after Abraham Maslow who said: “If the only tool you have is a hammer, you tend to see every problem as a nail.”
When stuff is numbered and written down and put in a spread sheet, a chart or a financial statement, it tends to take on credibility and authenticity, i.e. we tend to take it at face value. We tend not to look behind the numbers. Today’s post will focus on financial statements as an illustration of the problem that we tend to overweight stuff that can be numbered.
Financial statements
Financial statements are a wonderful tool to organize and present financial numbers. We would be lost without them. We can learn a lot from a company’s financial statements about its financial strength, economic performance and profitability. We can look at its capital structure, debt ratios, liquidity ratios, cash flows, free cash flow, profitability ratios and so on.
Of course, everybody knows that financial statements can be massaged, that they contain estimates and other subjective elements. Most investors are aware of this but I suspect they pay lip service to it.
Warren Buffett has written:
“The term ‘earnings’ has a precise ring to it. And when an earnings figure is accompanied by an unqualified auditor’s certificate, a naïve reader might think it comparable to certitude to [pi] calculated to dozens of decimal places.
In reality, however, earnings can be a pliable as putty when a charlatan heads the company reporting them. Eventually truth will surface, but in the meantime a lot of money can change hands. Indeed, some important American fortunes have been created by the monetization of accounting mirages.” (Buffett W. E., The Essays of Warren Buffett: Lessons for Corporate America. 1998) p168
Massaged and manipulated financial statements
Here are a few high-profile cases. In fact, dubious financial statements are ubiquitous.
General Electric is a well-known example of ‘managed’ earnings in which many items in the earnings statement which required judgement and discretion led to an understatement of earnings in good years with a corresponding overstatement in weak years so as to paint a picture of steadily improving earnings year after year.
It was only after the fact that we learned that Enron, a massive accounting scandal of he early 2000s, had used special-purpose vehicles to hide its debt and toxic assets from investors and creditors.
Many investors will remember the ‘Mark-to-market’ turmoil of the Great Financial Crisis in 2008 which led to the true worth of assets on companies’ books to be seriously overstated.
Adjusted numbers
One wonderful practice that has become very popular is the use of adjusted number that don’t comply with International Financial Reporting Standards (IFRS) or Generally Accepted Accounting Principles (GAAP).
Companies constantly report Adjusted Earnings. Let’s look at this. This magical term and its reporting are everywhere. Adjusted earnings are almost always higher than GAAP earnings. For the most part, management wish to present their performance in the very best possible light. Sadly, because of agency problems, investors need to question almost all financial statements. Agency problems occur when persons such as company management are supposed to act in the best interests of shareholders. In reality, we know that management have their own interests, different from shareholders and a potential conflict is ever present.
In 1998 Justin Fox wrote a brilliant satirical article for Fortune Magazine about a fictional company that reported quarterly EEBS earnings of $127 million. By way of explanation the CEO told analysts these were Earnings Excluding Bad Stuff. On a GAAP basis the company’s earnings were a loss of $2.4 billion. The CEO defended this on the basis that he had been told by the CFO, “You know, Skippy, if all this bad stuff hadn’t happened, we would be having a pretty good quarter.”
Warren Buffett in his shareholders letter in 2016 wrote: “it has become common for managers to tell their owners to ignore certain expense items that are all too real.” He added: that by parroting numbers provided by company executives, some analysts are “guilty of propagating misleading numbers that can deceive investors.”
The reporting of Adjusted Earnings is permitted by The Securities and Exchange Commission. However, the SEC requires companies to explain why there is a difference between reported and adjusted earnings. The practice is subject to frequent abuse by management using the adjusted numbers to pull the wool over the eyes of investors.
How large is this problem? In 2015 fourth quarter, adjusted earnings for the S&P 500 companies was 59% above GAAP. Some adjustments are reasonable to allow apples to apples comparisons of earnings to previous years or quarters. S&P Dow Jones Indices use adjusted earnings that differ from GAAP using a consistent methodology. It excludes items such as discontinued operations and truly extraordinary items. This methodology led to a 29% difference between reported GAAP earnings and adjusted used by S&P Dow Jones Indices. That is, 30% of the difference between GAAP and adjusted earnings was considered inappropriate for analysis purposes.
Phony rationale
A recurring source of adjustment to earnings is for companies to exclude acquisition-related expenses, including items like acquisition accounting valuation related expenses and severances associated with acquired businesses. The rationale provided is that acquisition costs obscure operating performance. But these costs are a true cost of doing business. The argument that it is simply to help investors focus on operating earnings is bogus. As well, some companies are constantly making ‘tuck in’ acquisitions. The acquisition expenses are never ending. If all these acquisition expenses keep recurring, where are the Owner Earnings?
Restructuring costs are another common expense that are commonly excluded in adjusted earnings but taken into account in GAAP earnings. The argument by management for excluding restructuring costs is that the restructuring creates lasting value for the future. More bafflegab. Restructuring costs, in particular, are the source of much deception by management. Some companies are in a permanent state of restructuring.
Another frequently excluded expense is litigation costs. But surely, in todays’ world these are an ordinary and recurring cost of doing business.
SBC
Technology companies quite commonly exclude Share-Based Compensation (SBC) as an expense in their adjusted earnings. It is difficult to see how such recurring expenses should be excluded in calculating earnings. Surely, they are a normal cost of doing business.
SBC is also commonly added back in in company cash flow statements. At the very least, investors should understand SBC significantly dilutes their shareholding.
Extraordinary every year
Many companies seem to have extraordinary expenses year after year! In looking at an average over a period of years, such as a five-year average, it is better not to remove extraordinary items as to do so will distort the real picture. But if the investor wants to adjust Net Income by excluding a particular write-down to give a better indication of continuing operating performance, so be it. Certainly, any gain on a sale of company assets should be removed. Such a gain is not operating performance by management or by the company. Theoretically all non-operating profit items should be deducted from earnings to provide the best indication of the company’s and management’s operating performance.
For companies with a massive amount of cash held as a war chest one might deduct the interest earned from the war chest from earnings as it does not represent operating earnings. This normally would be a small item but, in some companies, very significant. Some tech companies hold massive amounts of cash.
Write downs
GAAP earnings take an instant hit from a write down. Even though it reduces asset values, a book value reduction is a non-cash charge. Thus, it is reported as an expense and reduces net income. An example occurring in 2015 was the slew of impairment charges reported by companies in the energy sector. Another widespread example was in the aftermath of the 2008 financial crisis. It saw substantial goodwill write downs following tests for impairment.
Shareholders are soothed that the write down is not a cash loss. It is described as ‘simply a bookkeeping entry’! Many goodwill or tangible asset write downs occur when management has made a disastrous acquisition. The responsible CEO leaves with a golden handshake and the new management team promptly causes the company to take a massive write down. This destroys GAAP earnings for the year but gives new management a clean point of departure. Another time managements like to take write downs is when others in their industry or sector are doing so. They don’t stand out like a sore thumb.
It could be argued that using Adjusted Earnings to explain away some write downs is legitimate since companies do not write up assets that increase in value. That is, assets are carried at the lesser of cost or value. But investors need to understand the full significance of the write-down and not be misled by the happy picture created by the adjustment.
Jarislowsky makes a subtle point. He writes: “These days you see frequent ‘special charges’ or ‘restructuring.’ This normally leads to lower depreciation as major assets may have been written off. In turn, that overstates net income, though true cash income is relatively unchanged. This practice is not conservative, as depreciation should be defined as ‘wear and tear’ plus ‘obsolescence’, while the special charges reduce or eliminate obsolescence. If inadequate provisions are made for inventory or receivables, of if depreciation is insufficient, then there’s a good chance again that net income is being overstated.” (Jarislowsky, The Investment Zoo: Taming the Bulls and Bears. 2005) p122
Insight into management straightforwardness
Management that hides behind adjusted figures are suspect. Management that glosses over the inevitable negatives in some quarterly figures are suspect. Management that acknowledges the periodic weak numbers and accepts responsibility are being straightforward with shareholders. With practice it becomes quite easy to read between the lines. A certain level of boosterism is inevitable. One quickly becomes suspicious when this goes too far. One can also read these sources for insights into the entrepreneurial bent of management, leadership qualities, conservative approach to accounting, long term view, vision, strategy and administrative qualities.
The world is changing
As well, the world is changing. The data that go into financial statements suffer from non-stationarity. This is the statistical problem that the meaning of the input data changes over time. Let me give you an example.
David Hoeft is the chief investment officer and investment committee member at Dodge & Cox. In a spring 2024 Morningstar conversation ,he pointed out:
“Compared to 30 years ago, the ratio of intangible to tangible assets of the collective S&P 500 is up over 3 times, and more than 10 times for tech companies. So, if you narrowly define value as low price/book stocks, that isn’t likely to be a viable long-term investing strategy if you don’t have a more holistic insight into intangibles and other sources of value that may not show up directly on the balance sheet.”
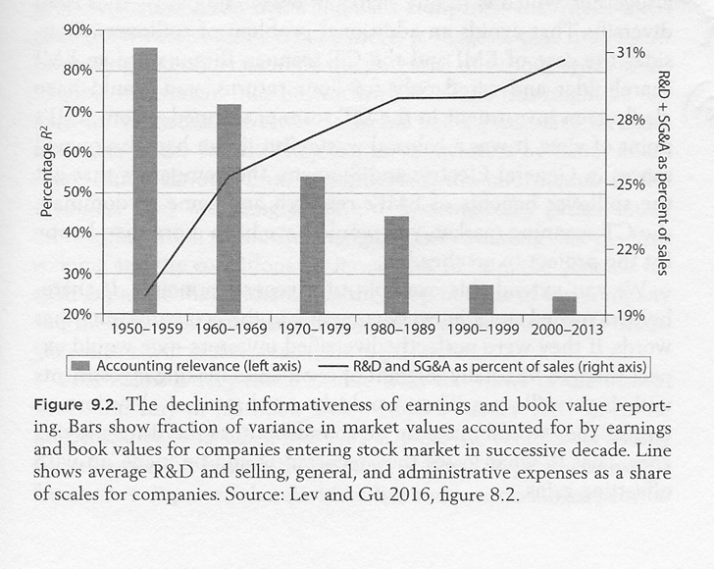
This was illustrated in a chart in a highly stimulating work by Jonathan Haskel, a professor of economics at Imperial College London and Stan Westlake , a senior fellow at Nasta, the UK’s national foundation for innovation titled Capitalism without Capital, the Rise of the Intangible Economy (Haskel & Westlake, 2018).
Haskel and Westlake include a chart that attempts to quantify what they call the declining informativeness of earnings and book value reporting regarding intangibles drawing on the work of Lev and Gu. It is a depressing story.
Declining informativeness of earnings and book value reporting
Conclusion
Successful investing does not lend itself to the mindless application of formulas or ratios to numbers derived from financial statements. Charlie Munger warns us not to overweigh the stuff that can be numbered. As Warren Buffett tells us, our job is to carry out a business analysis, not a security analysis. A business analysis is as much, if not more, a qualitative analysis as a quantitative analysis. It must be done with common sense and business sense. We must always remain skeptical of the numbers. As Warren Buffett put it in his 1986 Chairman’s letter: “…accounting is but an aid to business thinking, never a substitute for it.”
+++++++++++++++
For readers wishing to dig a little deeper into the art of analyzing the financial strength and economic performance of companies take a look at the Motherlode Chapter 35. Capital Structure, Strength and Economic Performance
This chapter contains the following sections:
35.04 Accounting treatment of intangibles
35.05 Accounting Goodwill and Economic Goodwill
35.07 Understated tangible assets
35.09 General discussion of debt and debt equity ratios
35.10 Debt to equity ratio conclusion
35.12 Net long term debt to free cash flow
35.14 Net long term debt to NOPAT
35.15 Conclusion regarding coverage ratios
35.16 Measuring Economic Performance
35.20 Impact of expensing intangible investments
35.22 Potentially the bigger problem
35.23 True value of equity, ROC, ROIC and ROCE
35.25 Coming up with free cash flow yield
35.26 ROC and a company’s cost of capital
35.28 Some examples of weighted average cost of capital using CAPM
35.29 Does the use of CAPM make sense in calculation the cost of equity?
35.30 Can we replace CAPM in calculations of cost of equity capital?
35.31 Earnings yields and cost of capital
35.32 Banks and life insurance companies
35.35 Other measures of company performance – Profit margins
35.36 Ratios used by management
35.38 Comparing with cost of capital
+++++++++++++++
You can reach me by email at rodney@investingmotherlode.com
I’m also on Twitter @rodneylksmith
+++++++++++++++
Want to dig deeper into the principles behind successful investing? Click on the ABOUT tab to read an introduction. It will help readers get the most out of the Nuggets of Investing Wisdom blog.
+++++++++++++++
Check out the Tags Index on the right side of the Home page that goes from ‘accounting goodwill’ to ‘wisdom of crowds’. This will give readers access to a host of useful topics.
+++++++++++++++
You can also use the word search feature on the right-hand side of this page to find references in both Nuggets blog posts and also in the Motherlode.
+++++++++++++++
To explore the Motherlode, click on the Motherlode tab
If you like this blog, tell your friends about it
And don’t hesitate to provide comments or share on Twitter and Facebook