

Financial data
Data as a moving target

In this post I will look at something that knocks the pins out from our normal understanding of price earnings ratios, return on invested capital, discounted cash flow analysis, smart beta/factor ETFs, value at risk models (VAR) and even company financial statements.
My thesis is that non-stationarity of data and systems is the Achilles heel of quantitative analysis in investing. By Achilles heel I mean a fatal flaw. By non-stationarity I mean changes in the attributes of data inputs. I also mean changes in the behavior of the financial system. I also mean the stock market as a complex adaptive system. You can Google ‘non-stationarity’ for more technical definition and applications.
Before your eyes glaze over, let me give you a recent example of how modellers were flummoxed by changes in the attributes of data inputs.
Virus a moving target
During the Covid pandemic health officials were trying to figure out how to flatten the curve. They worried that Covid patients would overwhelm intensive care units’ respirator capacity. They tried to assess the extent to which policies like lockdowns and mandatory masks would lower the impending peak of seriously ill patients. The problem was that new variants of the virus kept appearing. As a result, data such as transmissibility and severity of symptoms were non-stationary. I.e. the attributes of the data inputs were changing. The virus was a moving target.
I believe this is exactly what is happening, has happened and will continue to happen in the world of finance and investing.
A quote to get us started
John Kay and Mervyn King’s book published in 2020 is titled Radical Uncertainty – Decision-Making Beyond the Numbers. The authors are no slouches. They are both economists. Mervin King is a former governor of the Bank of England (comparable to the U.S. chair of the Federal Reserve) and a professor at New York University and emeritus professor at the London School of Economics. Kay is a Fellow of St John’s College and Oxford University.
They write: “Returns on investment are not random drawings from a known and stationary underlying process. Yet much financial analysis and much financial regulation are predicated on the assumption that they are.” (Kay/King 2020) p.333 (emphasis added)
This is one of the three key points of their book. They explain in some 400 pages that the world of economics, business and finance is non-stationary. Not only is the structure changing but the attributes of the inputs are changing. Let’s hold that thought for a moment.
Quantitative analysis (QA)
I started off talking about quantitative analysis. What is it?
We are told by Investopia that in the investment world: “QA is used to analyze investment opportunities, such as when to purchase or sell securities. Investors perform QA when using key financial ratios, such as the price-earnings ratio (P/E) or earnings per share (EPS), in their investment decision-making process (e.g., whether to purchasing shares of a company’s stock). QA ranges from the examination of simple statistical data (e.g., revenue) to complex calculations (e.g., discounted cash flow or option pricing).”
That is, quantitative analysis (QA) is a technique that uses mathematical and statistical modeling, measurement, and research to assist investment decisions.
Financial statements are non-stationary
Many of the data inputs for QA come from financial statements. So this is a good place to dig in. Let me give you one example of the non-stationarity of financial statements and their data outputs.
With the massive shift by companies away from spending on tangible assets to spending on intangible assets, the accounting rules create an asymmetry that is only getting worse as the years go by. Companies that acquire intangible assets through corporate acquisitions treat those intangible assets as assets. Companies that create intangible assets internally are, with certain limited exceptions, required to expense the related cash outlays. As a result the cost of creating major long-lived corporate assets ends up reducing net or reported earnings while, at the same time, creating long-lived intangible assets that do not appear on the balance sheet. For a look at how this impacts the cherished price earnings ratio see my post Is the price earnings ratio (P/E) obsolete?.
This has resulted in changes in the attributes of two key financial statement numbers: earnings and book value. That is, there is a very significant non-stationarity in these values.
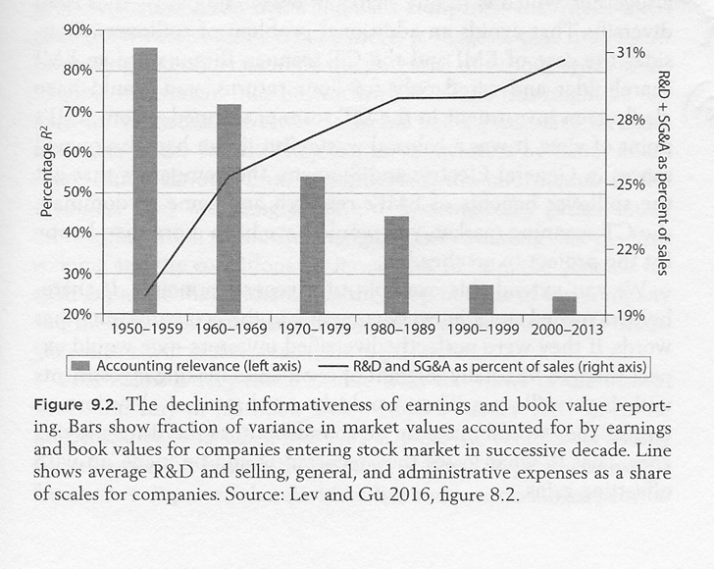
The impact on what we are able to learn from financial statements is profound. This has been studied. Jonathan Haskel, a professor of economics at Imperial College London and Stan Westlake , a senior fellow at Nasta, the UK’s national foundation for innovation have written a highly stimulating book about the growing importance of intangible assets in the economy and in business. It is titled Capitalism without Capital, the Rise of the Intangible Economy (Haskel & Westlake, 2018).
Haskel and Westlake have included a graph that attempts to quantify what they call the declining informativeness of earnings and book value reporting regarding intangibles drawn on the work of Lev and Gu. It is a depressing story.
Declining informativeness of earnings and book value reporting
Is there a fix?
A short blog post is no place to resolve these issues. I will mention one attempt that I think is doomed to failure. Some analysts have attempted to address the problem that company investment in intangibles of lasting value is not appearing on financial statement. They do it by capitalizing a portion or all of company R&D expenses and turning them from expenses into assets.
The problem is this. Accounting rules restrict the inclusion in the financial statements of internally developed intangible assets, such as brands or software that have been developed at high cost. IAS 38 requires an entity to recognize an intangible asset, whether purchased or self-created (at cost) if, and only if it is probable that the future economic benefits that are attributable to the asset will flow to the entity; and the cost of the asset can be measured reliably.
There is good reason why companies are not allowed to arbitrarily capitalize R&D expenses. It can give false weight to a balance sheet.
As Kay and King write: “We do not enhance our understanding of the future by inventing facts and figures to fill in the inescapable gaps in our knowledge.” (Kay/King 2020) p.403
Even at the best of times we have to look at financial statements with a jaundiced eye. Howard Marks has written: “Skepticism is what it takes to look behind a balance sheet, the latest miracle of financial engineering or the can’t-miss story…. Only a skeptic can separate the things that sound good and are from the things that sound good and aren’t. The best investors I know exemplify this trait. It’s an absolute necessity.” (Marks, The most important thing illuminated: uncommon sense for the thoughtful investor. 2013) pp.118-119
An escape from model land
There is a solution of sorts to all of this. First, we have to recognize we live in a world that is inherently uncertain. We can learn from a recent book written by Erica Thompson titled Escape from Model Land – How mathematical models can lead us astray and what we can do about it. She encourages decisions that are robust across a very wide range of futures. She encourages use human reason, life experience and humility to properly take advantage of models as tools. Kay and King also have some good ideas that revolve around constructing narratives and likely scenarios involving human judgement.
What is clear to me is that quants such as the developers and sellers of smart beta/factor ETFs that try to take human judgement out of the picture are setting their clients up for failure.
Conclusion
Some people think that investing is all about understanding numbers. The mistake many make is to think investing is only about numbers. We invest in businesses, not in financial statements. The businesses are run by people. They have products that compete in different markets. The competitive environment changes. Consumer tastes change. Technology changes. So, the numbers are only part of it.
Investors have access to analysts’ reports. The analysts do most of the number crunching for you. Most analysts are oblivious to the problem of non-stationary data. As a result, investors must use these reports wisely.
Having said that, investing does require some ability to understand statistics, financial statements and financial ratios such as Return on Invested Capital. What is needed is the ability to understand, for example, what a particular financial ratio means. This is something we can learn. We learn not only what it means but also its limitations, how it can be misleading and how to view it with a skeptical eye.
+++++++++++++++
To dig into the impact of non-stationarity on some well-known metrics take a look at the posts accessed through the following links:
+++++++++++++++
You can reach me by email at rodney@investingmotherlode.com
I’m also on Twitter @rodneylksmith
+++++++++++++++
Check out the Tags Index on the right side of the Home page that goes from ‘accounting goodwill’ to ‘wisdom of crowds’. This will give readers access to a host of useful topics.
+++++++++++++++
You can also use the word search feature on the right-hand side of this page to find references in both blog posts and also in the Motherlode.
+++++++++++++++
There is also a Table of Contents for the whole Motherlode when you click on the Motherlode tab.
Want to dig deeper into the principles behind successful investing?
Click here for the Motherlode – introduction.
If you like this blog, tell your friends about it
And don’t hesitate to provide comments or share on Twitter and Facebook
One thought on “The Achilles heel of the quantitative analysis of stocks”